The goal of flipped is to explore models for coin flippings beyond the standard binomial.
- Website: https://bomeara.github.io/flipped/
- Source: https://github.com/bomeara/flipped/
Installation
You can install the development version of this package from GitHub with:
# install.packages("devtools")
devtools::install_github("bomeara/flipped")
Example
Imagine we get 8 heads out of 10 coin flips. In standard stats, we’d do something like this:
library(flipped)
nflips <- 10
nheads <- 8
probability_heads <- seq(from=0, to=1, length.out=1000)
probability_data <- dbinom(nheads, nflips, probability_heads)
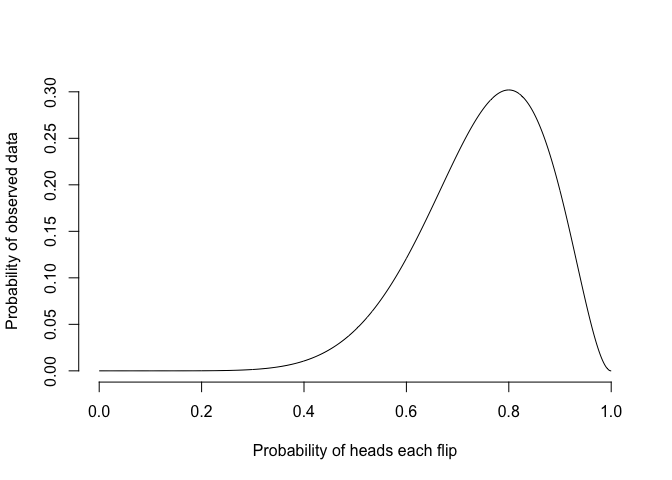
The probability of the data given different probabilities of heads under the standard binomial model is:
plot(probability_heads, probability_data, xlab="Probability of heads each flip", ylab="Probability of observed data", type="l", bty="n")
The best estimate from this is 0.8, and the likelihood of the data given this is 0.3. However, this model makes a strong assumption – the probability of heads is constant across flips. But coins are real objects, which can be bent, get dirty, lose metal, and more in the keyboard-roughened hands of a statistician. It’s not unreasonable to think that the act of handling and flipping a coin changes the probability of heads. We can make models that can do this.
One set of models could have a linear slope: every time a coin is handled, its probability of heads can increase or decrease by a set amount: 0.50, 0.51, 0.52. The parameters of such a model would be the starting probability of heads before a coin was handled and the slope of the change. The standard binomial model then becomes a special case of this model with slope arbitrarily set to zero. We could think of ways to restrict this to other models: a 0.010 increase per flip from a starting value, a 0.005 loss from a starting value, and so forth. The probability of heads for such models, where the probability of heads before handling is 0.50, would be:
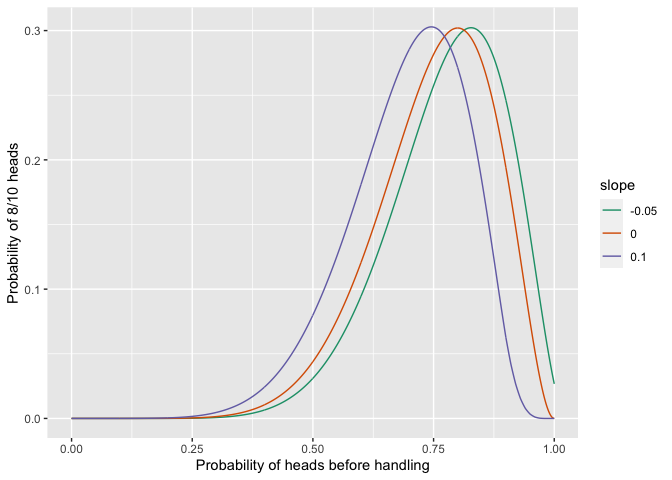
We can calculate the likelihoood of the observed data of 8 heads from 10 flips for all these models, changing the probability of heads for a coin before it is handled:
nheads <- 8
flat <- profile_linear_model(nheads, nflips, slope=0.0)
increasing <- profile_linear_model(nheads, nflips, slope=0.10)
decreasing <- profile_linear_model(nheads, nflips, slope=-0.05)
all_results <- rbind(flat, increasing, decreasing)
all_results$slope <- as.factor(c(rep(0, nrow(flat)), rep(0.10, nrow(increasing)), rep(-0.05, nrow(decreasing))))
print(ggplot(all_results, aes(x=preflip_prob, y=likelihood, colour=slope, group=slope)) + geom_line() + ylab("Probability of 8/10 heads") + xlab("Probability of heads before handling") + scale_colour_brewer(palette = "Dark2") )
They have different optimal parameter values, but the same likelihood:
print(round(flat[which.max(flat$likelihood),],2))
#>     preflip_prob likelihood
#> 800          0.8        0.3
print(round(increasing[which.max(increasing$likelihood),],2))
#>     preflip_prob likelihood
#> 746         0.75        0.3
print(round(decreasing[which.max(decreasing$likelihood),],2))
#>     preflip_prob likelihood
#> 828         0.83        0.3
This shows that these three models cannot be distinguished with likelihood – they’re congruent. So we can’t tell, with simple coin flipping, from just the final tally of heads and tails whether the probability of heads was increasing or decreasing with flips.
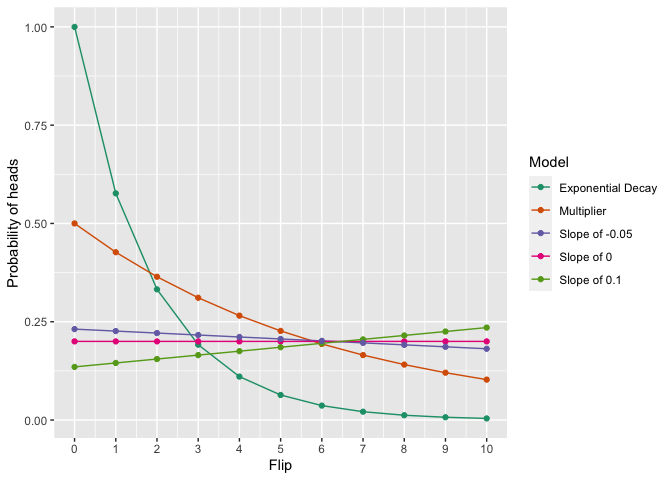
We can do this with multiple kinds of models, too: all these have the same probability of the data within a pre-set numerical precision:
nheads=2
nflips=10
congruent <- find_congruent_models(nheads=nheads, nflips=nflips)
#> [1] "Optimizing multiplicative model"
#> [1] "Got within 2.2260848755451e-06 of the target"
#> [1] "Optimizing exponential decay model"
#> [1] "Got within 6.33013396881821e-05 of the target"
#> [1] "Optimizing slope 0 model"
#> [1] "Got within 2.22044604925031e-16 of the target"
#> [1] "Optimizing slope 0.1 model"
#> [1] "Got within 8.74494624170108e-06 of the target"
#> [1] "Optimizing slope -0.05 model"
#> [1] "Got within 7.87077862062779e-05 of the target"
print(ggplot(congruent$probabilities_per_flip, aes(x=Flips, y=Probability_of_heads_this_flip, colour=Model, group=Model)) + geom_line() + geom_point() + ylab("Probability of heads") + scale_x_continuous(name="Flip", breaks=seq(from=0, to=nflips, by=1)) +
scale_colour_brewer(palette = "Dark2") )